模拟火车客运货运系统

模拟火车客运货运系统

提出过程:

​ 临近期末放假回家,外地的学生都避免不了一个购票抢票的话题,再加上这一个学期的所学知识,于是便想出了要去做出一个客运货运的查票系统,便于我们了解车票,然后进行设计购票。

项目的概述和功能分析
1
这个项目里面通过使用了Tkinter 模块设计出一个登录的GUI界面,但是后面的每一项具体的选择后的结果仍是在编译器里面进行。在这个项目中,同时还运用了Geo画出了中国地图并赋予特定城市的AQI指数,然后还通过matploitlib实现了不同城市的天气预报的最高最低气温的柱状图。同时还赋予了一个货运功能,这样便于通过里程数大致估算出寄件所需要的钱数,注意的是两城市间的距离是根据经纬度坐标算出的直线距离,这里会存在误差。
数据存储:

​ 这个项目直接简单的把txt文件当成一个数据库,把生成的数据用json格式写入。

1
2
3
4
5
6
7
8
9
10
11
12
13
14
15
16
17
18
19
20
21
22
23
24
25
26
27
28
29
30
31
32
33
34
35
36
37
38
39
40
41
42
43
44
45
46
47
48
49
50
51
52
import random
import datetime

start = ["北京", "上海", "广州", "深圳", "成都", "武汉", "西安", "郑州", "厦门", "南京", "济南"]
destination = ["北京", "上海", "广州", "深圳", "成都", "武汉", "西安", "郑州", "厦门", "南京", "济南"]
train_prefixes = ["G", "D", "Z", "K", "C", "T"]

def generate_info():
start_place = random.choice(start)
destination_place = random.choice(destination)
start_date = datetime.datetime.now().replace(year=2024, month=random.randint(1, 12), day=random.randint(1, 28),
hour=random.randint(7, 23), minute=random.randint(0, 59), second=0,
microsecond=0)
final_state = start_date + datetime.timedelta(hours=random.randint(2, 24), minutes=random.randint(0, 59))
train_turn = random.choice(train_prefixes) + str(random.randint(1, 9999))
price = random.randint(100, 1200)
return train_turn, price, start_place, destination_place, start_date, final_state

def reasonable_data(train_turn, price, start_date, final_state):
if 'G' in train_turn:
if final_state - start_date > datetime.timedelta(hours=12, minutes=59):
return False
elif price <= 400:
return False
elif 'Z' in train_turn:
if price > 600:
return False
elif 'K' in train_turn:
if price > 500:
return False
elif 'C' in train_turn:
if price > 200:
return False
elif 'T' in train_turn:
if price > 500:
return False
return True

with open("C:\\Users\\platycodon\\Desktop\\schedule.txt", 'w', encoding='utf-8') as fp:
for _ in range(1000):
train_turn, price, start_place, destination_place, start_date, final_state = generate_info()
if reasonable_data(train_turn, price, start_date, final_state) == True:
res = (f"{train_turn} {price} {start_place}-->{destination_place} {start_date} {final_state}\n")
fp.write(res)

# 用于获取空气质量的数据信息
# import akshare as ak
# import pandas as pd
# crypto_js_spot_df = ak.air_quality_rank()
# pd.set_option('display.max_rows', None) # 显示全部行
# pd.set_option('display.max_columns', None) # 显示全部列
# print(crypto_js_spot_df)

1719390302657.png

还有登陆密码的存储也是修改读入到其中:

1719390075105.png

对于列车信息后来我们使用了爬虫进行获取,但是鉴于测试代码阶段,并没用获得的真实的数据。

1
2
3
4
5
6
7
8
9
10
11
12
13
14
15
16
17
18
19
20
21
22
23
24
25
26
27
28
29
30
31
32
33
34
35
36
37
38
39
40
41
42
43
44
45
46
47
48
49
50
51
52
53
54
55
56
57
58
59
60
61
62
63
64
65
66
67
68
69
70
71
72
73
74
75
76
77
78
79
80
81
82
83
84
85
86
87
88
89
90
91
92
93
94
95
96
97
98
99
100
101
102
103
104
105
106
107
108
109
110
111
112
113
114
115
116
117
118
119
120
121
122
123
124
125
126
127
128
129
130
131
132
import requests
import json
from openpyxl import Workbook
from prettytable import PrettyTable
from save_city_list import get_city_data


class GetTrains:
def __init__(self, date, begin_id, end_id):
# 请求的目标链接
self.url = "https://kyfw.12306.cn/otn/leftTicket/query"
# cookies
self.cookies = {
'_uab_collina': '171324859263120074949415',
'JSESSIONID': '708D9C6917F9858184F462E86DC45BD0',
'_jc_save_fromStation': '%u82CF%u5DDE%2CSZH',
'_jc_save_toStation': '%u6C5D%u5DDE%2CROF',
'_jc_save_fromDate': '2024-04-30',
'_jc_save_wfdc_flag': 'dc',
'route': '9036359bb8a8a461c164a04f8f50b252',
'BIGipServerotn': '1172832522.24610.0000',
'BIGipServerpassport': '854065418.50215.0000',
'guidesStatus': 'off',
'highContrastMode': 'defaltMode',
'cursorStatus': 'off',
'_jc_save_toDate': '2024-04-30',
}
# 构建请求头
self.headers = {
'Accept': '*/*',
'Accept-Language': 'zh-CN,zh;q=0.9,en;q=0.8,en-GB;q=0.7,en-US;q=0.6,zh-TW;q=0.5',
'Cache-Control': 'no-cache',
'Connection': 'keep-alive',
'If-Modified-Since': '0',
'Pragma': 'no-cache',
'Referer': 'https://www.12306.cn/index/index.html',
'User-Agent': 'Mozilla/5.0 (Windows NT 10.0; Win64; x64) AppleWebKit/537.36 (KHTML, like Gecko) Chrome/124.0.0.0 Safari/537.36 Edg/124.0.0.0',
'X-Requested-With': 'XMLHttpRequest',
}
# 构建请求所需参数
self.params = {
"leftTicketDTO.train_date": date,
"leftTicketDTO.from_station": begin_id,
"leftTicketDTO.to_station": end_id,
"purpose_codes": "ADULT"
}
# 实例化美化表格对象
self.pt = PrettyTable()

def run(self):
# 对目标网址发送请求
res = requests.get(
self.url, headers=self.headers, params=self.params, cookies=self.cookies
).json()
data_list = res['data']['result']
# 构造表格的表头,用于展示和保存
header_list = [
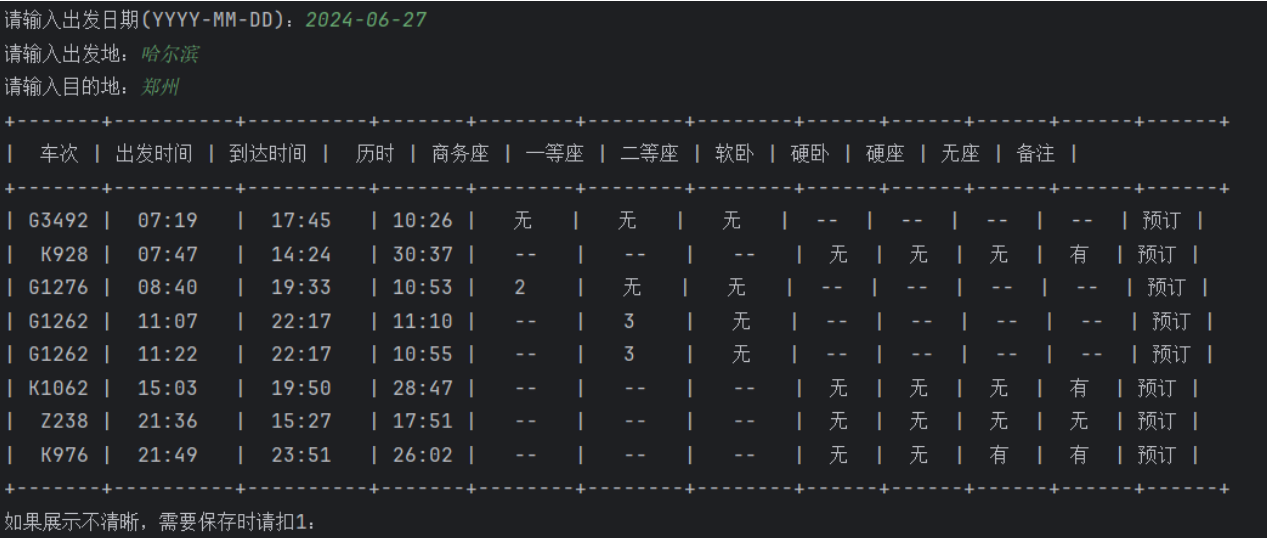
['车次', '出发时间', '到达时间', '历时', '商务座', '一等座', '二等座', '软卧', '硬卧', '硬座', '无座', '备注']
]
# 将表头信息添加进展示表格的表头
self.pt.field_names = header_list[0]
for data in data_list:
# 格式化添加表数据
trains_msg = self.format_data(data)
# 将数据添加进列表,用于保存
header_list.append(trains_msg)
# 打印表格
print(self.pt)
# 返回车次信息列表
return header_list

def format_data(self, data):
# 将返回的数据以'|'进行分隔
all_data_list = data.split('|')
# 提取车次的信息
trains_msg = [
all_data_list[3],
all_data_list[8],
all_data_list[9],
all_data_list[10],
all_data_list[32] if all_data_list[32] != "" else "--",
all_data_list[31] if all_data_list[31] != "" else "--",
all_data_list[30] if all_data_list[30] != "" else "--",
all_data_list[23] if all_data_list[23] != "" else "--",
all_data_list[28] if all_data_list[28] != "" else "--",
all_data_list[29] if all_data_list[29] != "" else "--",
all_data_list[26] if all_data_list[26] != "" else "--",
all_data_list[1] if all_data_list[1] != "" else "--"
]
# 增添表内容
self.pt.add_row(trains_msg)
# 将提取的信息返回,用于保存
return trains_msg

def save_data(self, trains_data_list, date, begin, end):
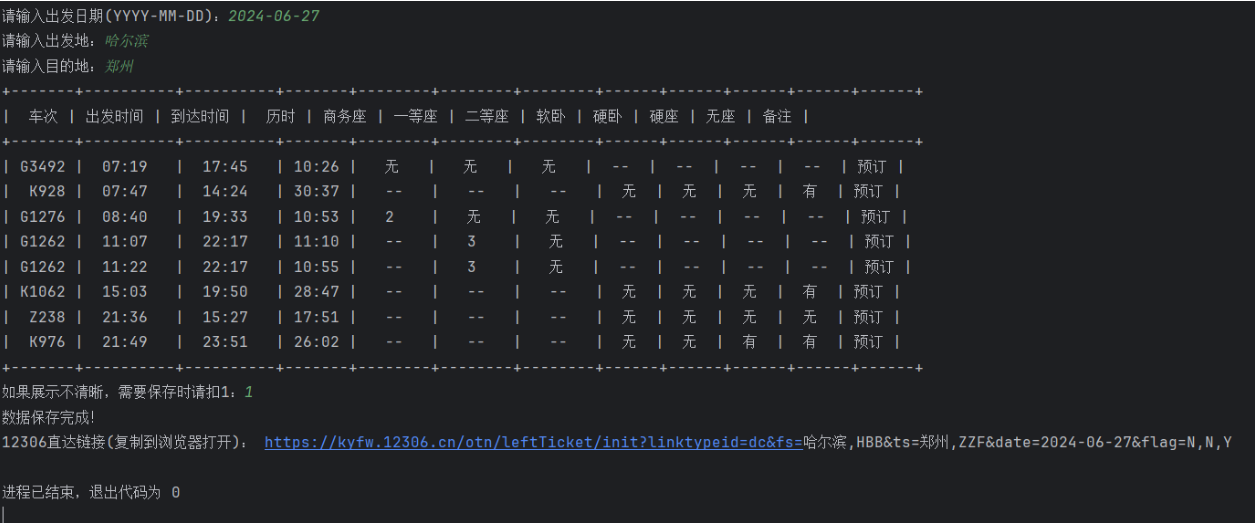
num = input("如果展示不清晰,需要保存时请扣1:")
if num == "1":
wb = Workbook()
sheet = wb.create_sheet("车次信息", -1)
# 遍历表格索引,写入数据
for x in range(len(trains_data_list)):
for y in range(len(trains_data_list[x])):
sheet.cell(x + 1, y + 1).value = trains_data_list[x][y]
wb.save(f"{date}_{begin}_{end}.xlsx")
print("数据保存完成!")


if __name__ == '__main__':
# 更新城市对应的英文代码,需要时再启用
# get_city_data()
date = input("请输入出发日期(YYYY-MM-DD):")
begin = input("请输入出发地:")
end = input("请输入目的地:")
# 读取生成的json文件
city_list = json.load(open('city_data.json', 'r'))
# 获取城市对应的英文代码
begin_id = city_list[begin]
end_id = city_list[end]
gt = GetTrains(date, begin_id, end_id)
trains_data_list = gt.run()
# 是否需要保存数据
gt.save_data(trains_data_list, date, begin, end)
print(
"12306直达链接(复制到浏览器打开):",
"https://kyfw.12306.cn/otn/leftTicket/init?"
"linktypeid=dc&"
f"fs={begin},{begin_id}&"
f"ts={end},{end_id}&"
f"date={date}&"
"flag=N,N,Y"
)

1
2
3
4
5
6
7
8
9
10
11
12
13
14
15
16
17
18
19
20
21
22
23
24
25
26
27
28
29
30
31
32
33
34
35
36
37
38
39
#coding=utf-8
import requests
import json


def get_city_data():
url = "https://kyfw.12306.cn/otn/resources/js/framework/station_name.js?station_version=1.9053"
print("正在获取数据。")
# 发送请求,获取返回的数据
res = requests.get(url)
data = str(res.content, encoding="utf8")
# 格式化返回的数据
response_format(data)


def response_format(data):
dict_data = dict()
# 根据'|'分隔数据
list_data = data.split('|')
# 从下标'1'开始, 每间隔5个为字典key
result_x = list_data[1:len(list_data):5]
# 从下标'2'开始, 每间隔5个为字典value
result_y = list_data[2:len(list_data):5]
# 循环将数据写入字典
for i in range(len(result_x)):
dict_data[result_x[i].replace(" ", "")] = result_y[i]
# 保存数据
save_data(dict_data)


def save_data(dict_data):
json_data = json.dumps(dict_data, indent=1, ensure_ascii=False)
with open("city_data.json", 'w') as w:
w.write(json_data)
print("数据保存完成!")


get_city_data()

1719391458122.png

1719391570913.png

设计过程:

​ 首先我们先写出一个关于登录注册的类,给出我们平常登录时所需要的注册登录过程,对于该类的每个方法需要加上@classmethod,否则两个不同的类之间调用的时候,会因为形参冲突出现报错。然后就考虑需要把数据进行存储,这里用的时json的数据格式,考虑到密码的保密性,对密码进行了一个简单的sha256加密。随后就在写一个类生成Tkinter的GUI界面,把其呈现出来。考虑到现实性,就是如果从未登录的话,要首先进行注册,然后在进行登录;在这期间,如果因为注册时登陆的密码或用户名与数据库中的不匹配,那么就会弹出一个登陆错误的窗口。

1
2
3
4
5
6
7
8
9
10
11
12
13
14
15
16
17
18
19
20
21
22
23
24
25
26
27
28
29
30
31
32
33
34
35
36
37
38
39
40
41
42
43
44
45
46
47
48
49
50
51
52
53
54
55
56
57
58
59
60
61
62
63
64
65
66
67
68
69
70
71
72
73
74
75
76
77
78
79
80
81
82
83
84
85
86
87
88
89
90
91
92
93
94
95
96
97
98
99
100
101
102
103
104
105
106
107
108
109
110
111
112
113
114
115
116
117
118
119
120
121
122
123
124
125
126
127
128
129
130
from tkinter import *
from tkinter import messagebox
from cowpy import cow
from pyecharts import options as opts
from pyecharts.charts import Geo
from pyecharts.globals import ChartType
import json
import hashlib
import matplotlib.pyplot as plt
import numpy as np
import random
import os

class login_signin:
@classmethod
def __init__(cls, username="", password=""):
cls.username = username
cls.password = password
cls.data_file = "..\\模仿12306\\sign_in.txt"

@classmethod
def is_registered(cls):
with open(cls.data_file, "r", encoding='utf-8') as file:
data = json.load(file)
username = a
if data['username'] == username:
return True
else:
return False

@classmethod
def sign(cls):
cls.username=""
cls.password=""
login_data = {'username': cls.username, 'password': cls.password}
cls.username = a
cls.password = b
login_data.update({'username': cls.username, 'password': hashlib.sha256(cls.password.encode()).hexdigest()})
with open("..\\模仿12306\\sign_in.txt", "w", encoding='utf-8') as file:
json.dump(login_data, file, ensure_ascii=False)
return login_data

@classmethod
def login(cls):
print("Welcome to the login interface ^v^ ")
file = open("..\\模仿12306\\sign_in.txt", "r", encoding='utf-8')
login_data = json.load(file)
cls.username = a
cls.password = b
if login_data['username'] == cls.username and login_data['password'] == hashlib.sha256(cls.password.encode()).hexdigest():
return True

class App(Frame):

def __init__(self,master=NONE):
super().__init__(master)
self.master=master
self.pack()
self.creat()

def creat(self):
self.v=StringVar()
self.v.set(1)
self.btn01=Radiobutton(self,text="注册",value=1,variable=self.v)
self.btn01.pack()
self.btn02=Radiobutton(self,text="登录",value=0,variable=self.v)
self.btn02.pack()
self.bt03=Button(self,text="确定",command=self.confim)
self.bt03.pack()
self.bt04=Button(self,text="退出",command=root.destroy)
self.bt04.pack()

def confim(self):
if self.v.get()=="1":
global newtk
newtk=Toplevel(root)
newtk.v1=StringVar()
newtk.v1.set("")
newtk.lab1=Label(newtk,text="用户名",width=6,height=2)
newtk.lab1.pack()
Entry(newtk,textvariable=newtk.v1).pack()
newtk.lab2=Label(newtk,text="密码",width=6,height=2)
newtk.lab2.pack()
newtk.v2=StringVar()
newtk.v2.set("")
newtk.en2=Entry(newtk,textvariable=newtk.v2,show="*")
newtk.en2.pack()
Button(newtk,text="确定",command=self.zhuce).pack()
newtk.geometry("400x300+200+200")
newtk.mainloop()
elif self.v.get()=="0":
root.destroy()
self.newtk=Tk()
self.newtk.v1=StringVar()
self.newtk.v1.set("")
self.newtk.lab1=Label(self.newtk,text="用户名",width=6,height=2)
self.newtk.lab1.pack()
Entry(self.newtk,textvariable=self.newtk.v1).pack()
self.newtk.lab2=Label(self.newtk,text="密码",width=6,height=2)
self.newtk.lab2.pack()
self.newtk.v2=StringVar()
self.newtk.v2.set("")
self.newtk.en2=Entry(self.newtk,textvariable=self.newtk.v2,show="*")
self.newtk.en2.pack()
Button(self.newtk,text="确定",command=self.denglu).pack()
self.newtk.geometry("400x300+200+200")
self.newtk.mainloop()

def zhuce(self):
global a
global b
a=newtk.v1.get()
b=newtk.v2.get()
newtk.destroy()
messagebox.showinfo("注册","注册成功,请登录")
login_signin.sign()

def denglu(self):
global a
global b
a=self.newtk.v1.get()
b=self.newtk.v2.get()
with open ("..\\模仿12306\\sign_in.txt") as fp:
data = json.load(fp)
if a==data['username'] and hashlib.sha256(b.encode()).hexdigest()== data['password']:
self.newtk.destroy()
messagebox.showinfo("登录","登录成功")
menu()
elif a!=data['username'] or hashlib.sha256(b.encode()).hexdigest()!=data['password'] :
messagebox.showinfo("登录","用户名或者密码错误,请重新登录")

1719326408779.png

1719326471221.png

1719326557711.png

登录错误;

1719326602651.png

第二,把登陆后的界面大致分为客运货运两类:客运和货运

1
2
3
4
5
6
7
8
9
10
11
12
13
14
15
16
17
def menu():
global mutk1
mutk1=Tk()
mutk1.geometry("400x300+200+200")
mutk1.bt1=Button(text="客运火车",command=keyun).pack()
mutk1.bt2=Button(text="货运火车",command=huoyun).pack()
mutk1.bt3=Button(text="退出",command=chuzu).pack()
mutk1.mainloop()
def keyun():
mutk1.destroy()
choice_train()

def huoyun():
mutk1.destroy()
choice_truck()


客运:我们分为5个主要功能分别是通过车次类型筛查,乘车时间点筛查,始发地筛查(始发地筛查中有按价格排序,按时间排序。)其中输入按时间排查过后会同时显示出对应的气温最低最高的柱状图。下面附上相应功能的代码和效果图:我们先要读取列车时刻表的数据库中的内容:

1
2
3
4
5
6
7
8
9
def read_data():
with open("..\\模仿12306\\train_schedule.txt", 'r', encoding='utf-8') as fp:
lines = fp.readlines()
result = []
for line in lines:
line = line.replace('\n', '')
result.append(line)
return result

①:车次类型筛查:

1
2
3
4
5
6
7
def choice_1():
print("请输入车次类型(G:高铁,D:动车,Z:直达,K:普快,T:特快,C:城际铁路):")
turn = input()
watchable = read_data()
for var in watchable:
if turn in var:
print(var)

1719327168648.png

② 乘车时间的筛查:

1
2
3
4
5
6
7
8
9
10
11
12
13
14
15
16
17
18
19
20
21
22
23
24
25
26
27
28
29
30
31
32
33
34
35
36
37
38
39
40
41
42
43
44
45
46
47
48
49
50
51
52
53
54
55
56
57
58
59
60
61
62
63
64
65
66
67
68
69
70
71
72
73
def what_is_the_temperature(date):
low_temperature_sprinter = [i for i in range(0,10)]
high_temperature_sprinter = [i for i in range(11,18)]
low_temperature_summer = [i for i in low_temperature_sprinter]
high_temperature_summer = [i for i in high_temperature_sprinter]
low_temperature_autumn = [i for i in range(15,20)]
high_temperature_autumn = [i for i in range(23,34)]
high_temperature_winter = [i for i in range(8,15)]
low_temperature_winter = [i for i in range(-2,5)]
cities = ["北京", "上海", "广州", "深圳", "成都", "武汉", "西安", "郑州", "厦门", "南京", "济南"]
temperatures = {
"spring": {city: {"max": random.choice(high_temperature_sprinter), "min": random.choice(low_temperature_sprinter)} for city in cities},
"summer": {city: {"max": random.choice(high_temperature_summer), "min": random.choice(low_temperature_summer)}for city in cities},
"autumn": {city: {"max": random.choice(high_temperature_autumn), "min": random.choice(low_temperature_autumn)} for city in cities},
"winter": {city: {"max":random.choice(high_temperature_winter), "min":random.choice(low_temperature_winter)} for city in cities}
}
plt.rc("font", family='Microsoft YaHei') # 这里的用途确保中文能够输出 !!!
plt.figure(figsize=(12, 6))
x_values = np.arange(len(cities)) # 城市的索引位置
bar_width = 0.35
if int(date[6]) >=3 and int(date[6]) <= 5:
max_temperature = [temperatures["spring"][i]["max"] for i in cities]
min_temperature = [temperatures["spring"][j]["min"] for j in cities]
plt.bar(x_values, max_temperature,bar_width, align='center',label = 'Temperature', color='blue')
plt.bar(x_values+bar_width, min_temperature,bar_width,align='center',label = 'Temperature', color='yellow')
plt.xlabel("Cities")
plt.ylabel("Temperature")
plt.title("Temperature of cities")
plt.xticks(x_values + bar_width / 2, cities, rotation=45)
plt.legend()
plt.show()
elif int(date[6]) >=6 and int(date[6]) <=8:
max_temperature = [temperatures["summer"][i]["max"] for i in cities]
min_temperature = [temperatures["summer"][j]["min"] for j in cities]
plt.bar(x_values, max_temperature,bar_width, align='center',label = 'Temperature', color='blue')
plt.bar(x_values+bar_width, min_temperature,bar_width,align='center',label = 'Temperature', color='yellow')
plt.xlabel("Cities")
plt.ylabel("Temperature")
plt.title("Temperature of cities")
plt.xticks(x_values + bar_width / 2, cities, rotation=45)
plt.legend()
plt.show()
elif int(date[6]) >=9 and int(date[6]) <= 11:
max_temperature = [temperatures["autumn"][i]["max"] for i in cities]
min_temperature = [temperatures["autumn"][j]["min"] for j in cities]
plt.bar(x_values, max_temperature,bar_width, align='center',label = 'Temperature', color='blue')
plt.bar(x_values+bar_width, min_temperature,bar_width,align='center',label = 'Temperature', color='yellow')
plt.xlabel("Cities")
plt.ylabel("Temperature")
plt.title("Temperature of cities")
plt.xticks(x_values + bar_width / 2, cities, rotation=45)
plt.legend()
plt.show()
else:
max_temperature = [temperatures["winter"][i]["max"] for i in cities]
min_temperature = [temperatures["winter"][j]["min"] for j in cities]
plt.bar(x_values, max_temperature,bar_width, align='center',label = 'Temperature', color='blue')
plt.bar(x_values+bar_width, min_temperature,bar_width,align='center',label = 'Temperature', color='yellow')
plt.xlabel("Cities")
plt.ylabel("Temperature")
plt.title("Temperature of cities")
plt.xticks(x_values + bar_width / 2, cities, rotation=45)
plt.legend()
plt.show()

def choice_2():
print("请输入所需时间点:")
time_start = input("样例:2024-11-20 08:32:00")
time_see = read_data()
for var in time_see:
if time_start in var:
print(var)
what_is_the_temperature(time_start.split()[0])

运行结果如下图:

1719405811607.png

1719327588746.png

③ 始发地:

1
2
3
4
5
6
7
8
9
10
11
12
13
14
15
16
17
18
19
20
21
22
23
24
25
26
27
28
29
def choice_3():
start = input("出发地:")
destination = input("目的地:")
place = read_data()
with open("..\\模仿12306\\specific_city.txt", 'w', encoding='utf-8') as file_:
for var in place:
if f"{start}-->{destination}" in var.split()[2]:
file_.write(var + '\n')
print(var)

def choice_3_1():
print("1.按价格排序")
print("2.按时间排序")
print("3.退出")
choice = input()
if choice == "1":
price_sort()
return choice_3_1()
elif choice == "2":
time_sort()
return choice_3_1()
elif choice == "3":
return choice_train()
else:
print("Invalid")

def mix_choice_3():
choice_3()
choice_3_1()

1719405973127.png

④:按价格排序:

1
2
3
4
5
6
7
8
9
10
11
12
13
14
15
16
17
18
19
20
21
22
23
24
25
26
27
28
29
30
31
32
def price_sort():
d=open("..\\模仿12306\\train_schedule.txt", "r",encoding='utf-8')
c=[""]
b=""
e=[]
f=[]
p=""
while c!=[]:
c=d.readline().split()
if c!=[]:
f+=[c]
for j in range(len(f)):
for i in range(len(f[j][1])):
if f[j][1][i]=="y":
break
else:
b+=f[j][1][i]
e+=[eval(b)]
b=""
pai={}
for i in range(len(e)):
pai[e[i]]=i
e.sort()
for i in range(len(e)):
d=open("..\\模仿12306\\train_schedule.txt", "r",encoding="utf-8")
for j in range(len(e)):
if j !=pai[e[i]]:
p=d.readline()
elif j==pai[e[i]]:
p=d.readline()
print(p)
d.close()

1719406038752.png

⑤ 按时间差大小排序:

1
2
3
4
5
6
7
8
9
10
11
12
13
14
15
16
17
18
19
20
21
22
23
24
25
26
27
28
29
30
31
32
33
34
35
36
37
38
39
40
41
42
43
44
45
46
47
def time_sum(x):
a=x[1]*30*24*60+x[2]*24*60+x[3]*60+x[4]
return a

def time_sort():
a=[]
d=open("..\\模仿12306\\train_schedule.txt", 'r', encoding='utf-8')
c=[""]
b=0
e=[]
f=[]
p=""
o=[]
shijian=[]
while c!=[]:
c=d.readline().split()
if c!=[]:
f+=[c]
for i in range(len(f)):
a=f[i][3].split("-")+f[i][4].split(":")
for g in range(len(a)):
a[g]=int(a[g])
e+=[a]
a=[]
for i in range(len(f)):
a=f[i][5].split("-")+f[i][6].split(":")
for g in range(len(a)):
a[g]=int(a[g])
o+=[a]
a=[]
for i in range(len(e)):
b+=time_sum(o[i])-time_sum(e[i])
shijian+=[b]
b=0
suoyin={}
for i in range(len(shijian)):
suoyin[shijian[i]]=i
shijian.sort()
for i in range(len(shijian)):
d=open("..\\模仿12306\\train_schedule.txt", 'r', encoding='utf-8')
for j in range(len(shijian)):
if j !=suoyin[shijian[i]]:
p=d.readline()
elif j==suoyin[shijian[i]]:
p=d.readline()
print(p)
d.close()

image-20240626204844488

⑥ 查看全国城市AQI指数:

1
2
3
4
5
6
7
8
9
10
11
12
13
14
15
16
17
18
def air_AQI():
keys = ["北京", "上海", "广州", "深圳", "成都", "武汉", "西安", "郑州", "厦门", "南京", "济南"]
values = [204.0, 59.0, 71.0, 38.0, 53.0, 89.0, 99.0, 95.0, 62.0, 56.0, 161.0]

c = (
Geo()
.add_schema(maptype="china")
.add(
"空气质量AOI指数图",
[list(z) for z in zip(keys, values)],
type_=ChartType.EFFECT_SCATTER,
)
.set_series_opts(label_opts=opts.LabelOpts(is_show=False))
.set_global_opts(title_opts=opts.TitleOpts(title="全国主要城市空气质量AQI图"))
.render()
)
# 打开html
os.system("render.html")

1719328583423.png

其中蓝点能够显示AQI指数:

image-20240625233623070

⑦退出:

1719406349144.png

整个过程都整合到下面的函数代码中

1
2
3
4
5
6
7
8
9
10
11
12
13
14
15
16
17
18
19
20
21
22
def choice_train():
print("=== 车票查询 ===")
print("1.车次类型:")
print("2.乘车时间点:")
print("3.始发地:")
print("4.查看全国城市AQI指数")
print("5.退出")
n = input("请输入数字:")
if n == '1':
choice_1()
elif n == '2':
choice_2()
elif n == '3':
mix_choice_3()
elif n == '4':
air_AQI() #这里返回的是html界面
return choice_train()
elif n == '5':
return menu()
else:
print("invalid,rewrite!!!")
return choice_train()

货运

这里的货运实现的是寄货运货的功能,里面涉及到的距离是通过运用haversine公式,通过两地的经纬度计算出两地的距离。

1
2
3
4
5
6
7
8
9
10
11
12
13
14
15
16
17
18
19
20
21
22
23
24
25
26
27
28
29
30
31
32
33
34
35
36
37
38
39
40
41
42
43
44
45
46
47
48
49
50
51
52
53
54
55
56
57
58
59
60
61
62
63
64
65
66
67
68
69
70
def haversine(lat1, lon1, lat2, lon2):
import math
if lat1 < 0 or lat1 > 90 or lat2 < 0 or lat2 > 90 or lon1 < 0 or lon1 > 180 or lon2 > 180 or lon2 < 0:
return "Sorry, I don't understand"
else:
r = 6371
lat1_radians = (lat1/180)*math.pi
lat2_radians = (lat2/180)*math.pi
lon1_radians = (lon1/180)*math.pi
lon2_radians = (lon2/180)*math.pi
d = 2 * r * math.asin(math.sqrt((math.sin((lat2_radians-lat1_radians) / 2)) ** 2 + math.cos(lat1_radians) * math.cos(lat2_radians) * (math.sin((lon2_radians-lon1_radians) / 2)) ** 2))
return d

def place_station():
l =[]
station = ["北京", "上海", "广州", "深圳", "成都", "武汉", "西安", "郑州", "厦门", "南京", "济南"]
for element in station:
for element1 in station:
ans = f"{element}-->{element1}"
if element == element1:
pass
else:
l.append(ans)
return l

def distance():
l = []
place_ = {"北京":(116.328175,39.900772), "上海":(121.326533,31.200282), "广州":(113.264499,23.130061), "深圳":(114.057939,22.543527), "成都":(104.066301,30.572961), "武汉":(114.304569,30.593354), "西安":(108.939645,34.343207), "郑州":(113.625351,34.746303), "厦门":(113.625351,34.746303), "南京":(118.796624,32.059344), "济南":(117.120128,36.652069)}
for place in place_:
for place1 in place_:
lat1,lon1 = place_[place][1],place_[place][0]
lat2,lon2 = place_[place1][1],place_[place1][0]
res = haversine(lat1,lon1,lat2,lon2)
if res == 0:
pass
else:
l.append(round(res,1))
place_name = place_station()
return dict(zip(place_name,l))

def weigh(mass):
if mass <= 2.5*10**3:
res = mass*0.5
return res
elif mass > 2.5*10**3 and mass <= 5*10**3:
res = mass*1
return res
else:
res = mass*2
return res

def price():
mass = float(input("请输入你的货物质量(1.0)"))
price_station = distance()
l = []
for dis in price_station:
temp = price_station[dis]
price = temp*weigh(mass)
l.append(price)
place_name = place_station()
return dict(zip(place_name,l))
def choice_truck():
start_place = input("请输入你的出发地:")
final_place = input("请输入你的寄件地:")
place = f"{start_place}-->{final_place}"
dictionary = price()
for vara in dictionary.keys():
if place == vara:
print(dictionary[vara])
return menu()

1719375689507.png

最后就是退出功能了,这里在退出时设计了一个小弹窗,通过cowsay板块稍加渲染,展示出一幅活泼的画面。

1
2
3
4
5
6
def chuzu():
mutk1.destroy()
messagebox.showinfo("感谢使用",cow_say())
def cow_say():
msg = cow.milk_random_cow("Zaku,Zaku,Zaku,Zaku")
return msg

1719375925780.png

总结:

​ 经过这次项目的设计,使全组成员对python有了一个更深层次的理解。而且还同时锻炼了编程思维,在一定程度上还锻炼出一种创造力。不仅如此,还形成了攻坚克难,积极学习,团结一致的良好的团队精神。在debug环节中感受到了修改代码的苦与修改成功的乐,还顺带对相应知识的深刻理解与感悟。

​ 正是因为这样敢于试错,不怕困难的精神,才能够使该项目呈现出来。以后的学习中,我们还需不断磨练自己,是自己最后能够真正的成为一个能人巧匠。

未来程序改进:

首先针对整个程序的GUI和一些可视化界面在做不断的完善,实现全部的可视化;其次因为我们的数据库是通过随机生成的伪数据,不够精准,需要把所有数据替换成爬虫得到的数据,然后就是对于两点间的铁路距离问题,可以创建一个机器学习的大模型进行不断的训练,然后得到全国范围内的两地之间的火车站的距离。


模拟火车客运货运系统
http://example.com/2024/06/27/模拟火车客运货运系统/
作者
John Doe
发布于
2024年6月27日
许可协议